Api regional
Summary
All regional effect methods have a similar interface and workflow:
- create an instance of the regional effect method you want to use
- (optional)
.fit()to customize the method .summary()to print the partition tree found for each feature.plot()to plot the regional effect of a feature at a specific node.eval()to evaluate the regional effect of a feature at a specific node at a specific grid of points
Usage
# set up the input
X = ... # input data
predict = ... # model to be explained
jacobian = ... # jacobian of the model
-
Create an instance of the regional effect method you want to use:
effector.RegionalPDP(data=X, model=predict)effector.RegionalRHALE(data=X, model=predict, model_jac=jacobian)effector.RegionalShapDP(data=X, model=predict)effector.RegionalALE(data=X, model=predict)effector.DerPDP(data=X, model=predict, model_jac=jacobian) -
Customize the regional effect method (optional):
.fit(features, **method_specific_args)This is the place for customization
The
.fit()step can be omitted if you are ok with the default settings; you can directly call the.summary(),.plot(), or.eval()methods. However, if you want more control over the fitting process, you can pass additional arguments to the.fit()method. Check the Usage section below and the method-specific documentation for more information.Usage
# customize the space partitioning algorithm space_partitioner = effector.space_partitioning.Best( min_heterogeneity_decrease_pcg=0.3, # percentage drop threshold (default: 0.1), max_split_levels=1 # maximum number of split levels (default: 2) ) r_method.fit( features=[0, 1], # list of features to be analyzed space_partitioner=space_partitioner # space partitioning algorithm (default: effector.space_partitioning.Best) ) -
Print the partition tree found for each feature in
features:.summary(features)Usage
features = [...] # list of features to be analyzed
r_method.summary(features)
Example Output
Feature 3 - Full partition tree: 🌳 Full Tree Structure: ─────────────────────── hr 🔹 [id: 0 | heter: 0.43 | inst: 3476 | w: 1.00] workingday = 0.00 🔹 [id: 1 | heter: 0.36 | inst: 1129 | w: 0.32] temp ≤ 6.50 🔹 [id: 3 | heter: 0.17 | inst: 568 | w: 0.16] temp > 6.50 🔹 [id: 4 | heter: 0.21 | inst: 561 | w: 0.16] workingday ≠ 0.00 🔹 [id: 2 | heter: 0.28 | inst: 2347 | w: 0.68] temp ≤ 6.50 🔹 [id: 5 | heter: 0.19 | inst: 953 | w: 0.27] temp > 6.50 🔹 [id: 6 | heter: 0.20 | inst: 1394 | w: 0.40] -------------------------------------------------- Feature 3 - Statistics per tree level: 🌳 Tree Summary: ───────────────── Level 0🔹heter: 0.43 Level 1🔹heter: 0.31 | 🔻0.12 (28.15%) Level 2🔹heter: 0.19 | 🔻0.11 (37.10%) -
Plot the regional effect of a feature at a specific node:
.plot(feature, node_idx)Usage
feature = ...
node_idx = ...
r_method.plot(feature, node_idx, **plot_specific_args)
Output
node_idx=1: \(x_1\) when \(x_2 \leq 0\)node_idx=2: \(x_1\) when \(x_2 > 0\)r_method.plot(0, 1)r_method.plot(0, 2)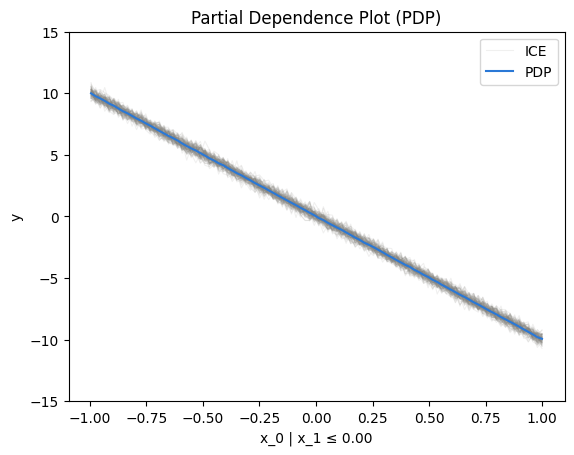
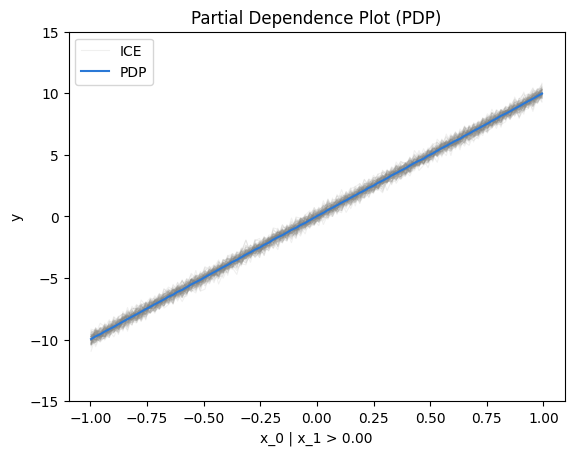
node_idx=1: \(x_1\) when \(x_2 \leq 0\)node_idx=2: \(x_1\) when \(x_2 > 0\)r_method.plot(0, 1)r_method.plot(0, 2)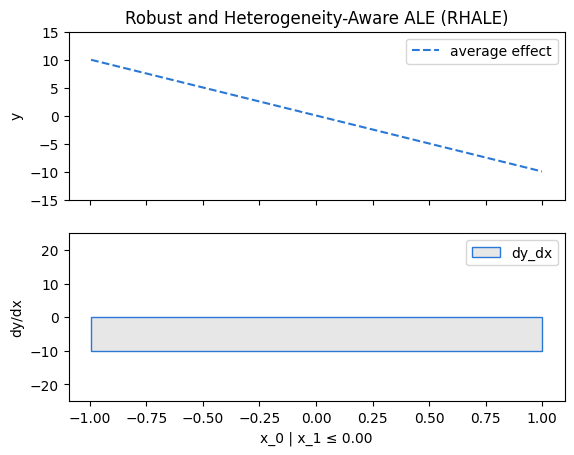
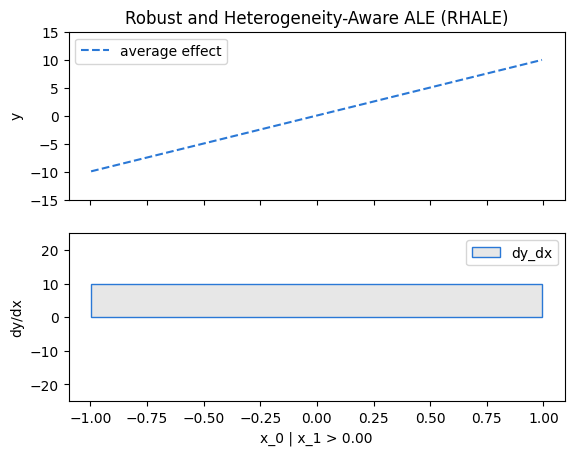
node_idx=1: \(x_1\) when \(x_2 \leq 0\)node_idx=2: \(x_1\) when \(x_2 > 0\)r_method.plot(0, 1)r_method.plot(0, 2)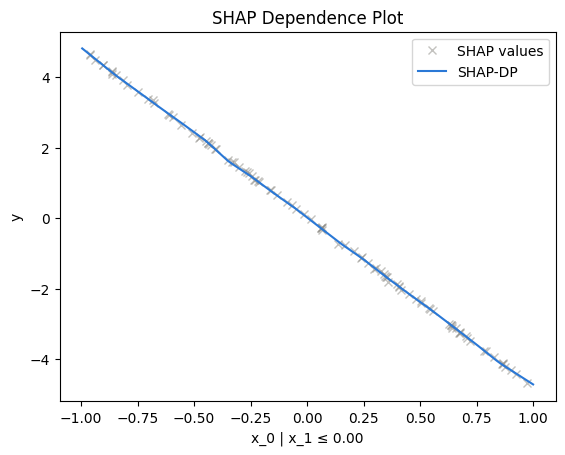
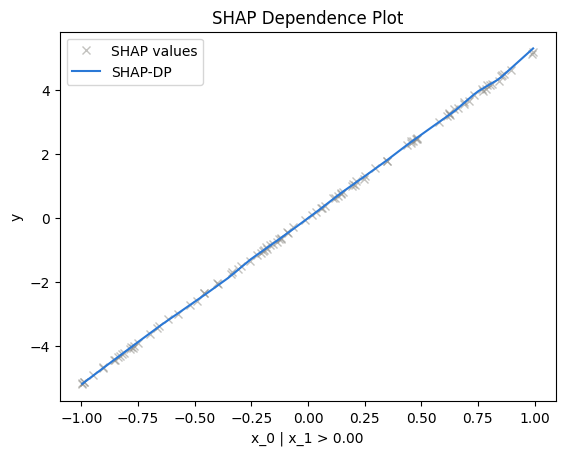
node_idx=1: \(x_1\) when \(x_2 \leq 0\)node_idx=2: \(x_1\) when \(x_2 > 0\)r_method.plot(0, 1)r_method.plot(0, 2)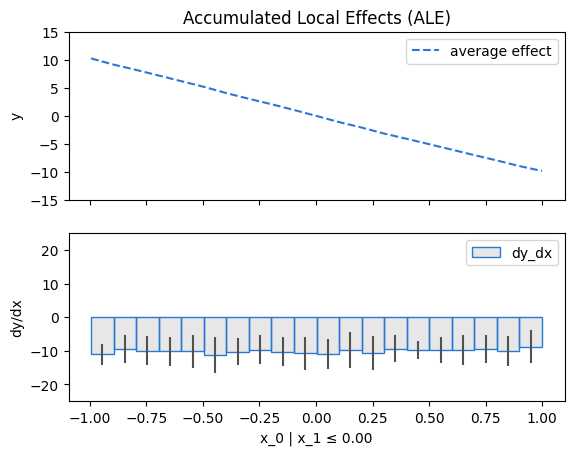
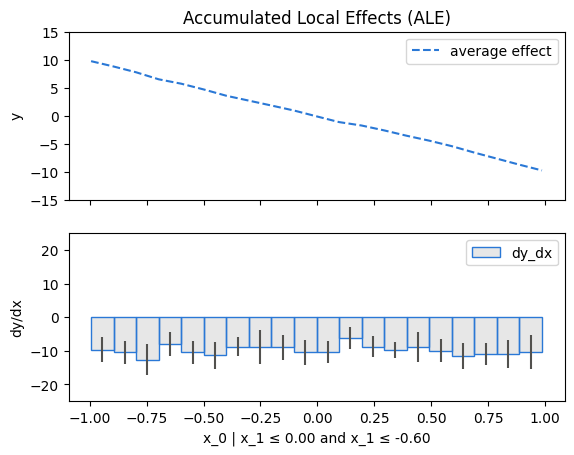
node_idx=1: \(x_1\) when \(x_2 \leq 0\)node_idx=2: \(x_1\) when \(x_2 > 0\)r_method.plot(0, 1)r_method.plot(0, 2)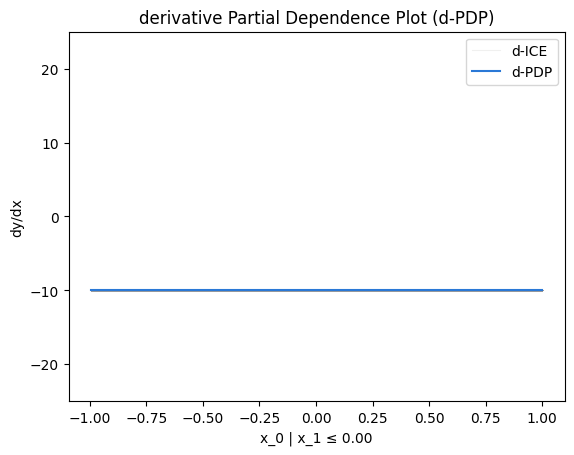
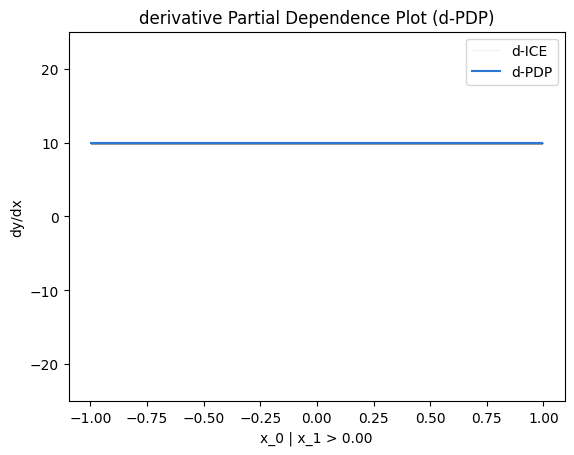
-
Evaluate the regional effect of a feature at a specific node at a specific grid of points:
.eval(feature, node_idx, xs)Usage
# Example input feature = ... # feature to be analyzed node_idx = ... # node index xs = ... # grid of points to evaluate the regional effect, e.g., np.linspace(0, 1, 100)y, het = r_method.eval(feature, node_idx, xs, heterogeneity=True)
API
Constructor for the RegionalEffect class.
Methods:
| Name | Description |
|---|---|
eval |
|
summary |
|
Source code in effector/regional_effect.py
19 20 21 22 23 24 25 26 27 28 29 30 31 32 33 34 35 36 37 38 39 40 41 42 43 44 45 46 47 48 49 50 51 52 53 54 55 56 57 58 59 60 61 62 63 64 65 66 67 68 69 70 71 72 73 74 75 76 77 78 79 80 81 82 83 84 85 86 | |
eval(feature, node_idx, xs, heterogeneity=False, centering=None)
 Evaluate the regional effect for a given feature and node.
The heterogeneity argument changes the return value of the function.
- If
heterogeneity=False, the function returnsy - If
heterogeneity=True, the function returns a tuple(y, h)wherehis the heterogeneity curve (eval_heter)
Parameters:
| Name | Type | Description | Default |
|---|---|---|---|
feature
|
int
|
index of the feature |
required |
node_idx
|
int
|
index of the node |
required |
xs
|
ndarray
|
horizontal grid of points to evaluate on |
required |
heterogeneity
|
bool
|
whether to also return the heterogeneity curve
|
False
|
centering
|
Union[None, bool, str]
|
whether to center the regional effect. The following options are available:
|
None
|
Returns:
| Type | Description |
|---|---|
Union[ndarray, Tuple[ndarray, ndarray]]
|
the mean effect |
Source code in effector/regional_effect.py
260 261 262 263 264 265 266 267 268 269 270 271 272 273 274 275 276 277 278 279 280 281 282 283 284 285 286 287 288 289 290 291 292 293 294 295 296 297 298 299 300 301 302 303 304 305 | |
summary(features, scale_x_list=None)
Summarize the partition tree for the selected features.
Example output
Feature 3 - Full partition tree:
🌳 Full Tree Structure:
───────────────────────
hr 🔹 [id: 0 | heter: 0.43 | inst: 3476 | w: 1.00]
    workingday = 0.00 🔹 [id: 1 | heter: 0.36 | inst: 1129 | w: 0.32]
        temp ≤ 6.50 🔹 [id: 3 | heter: 0.17 | inst: 568 | w: 0.16]
        temp > 6.50 🔹 [id: 4 | heter: 0.21 | inst: 561 | w: 0.16]
    workingday ≠ 0.00 🔹 [id: 2 | heter: 0.28 | inst: 2347 | w: 0.68]
        temp ≤ 6.50 🔹 [id: 5 | heter: 0.19 | inst: 953 | w: 0.27]
        temp > 6.50 🔹 [id: 6 | heter: 0.20 | inst: 1394 | w: 0.40]
--------------------------------------------------
Feature 3 - Statistics per tree level:
🌳 Tree Summary:
─────────────────
Level 0🔹heter: 0.43
    Level 1🔹heter: 0.31 | 🔻0.12 (28.15%)
        Level 2🔹heter: 0.19 | 🔻0.11 (37.10%)
Parameters:
| Name | Type | Description | Default |
|---|---|---|---|
features
|
List[int]
|
indices of the features to summarize |
required |
scale_x_list
|
Union[None, bool, List]
|
list of scaling factors for each feature
|
None
|
Source code in effector/regional_effect.py
345 346 347 348 349 350 351 352 353 354 355 356 357 358 359 360 361 362 363 364 365 366 367 368 369 370 371 372 373 374 375 376 377 378 379 380 381 382 383 384 385 386 387 388 389 390 391 392 393 394 395 396 397 398 399 400 401 402 403 404 405 406 | |
effector.regional_effect_ale.RegionalALE(data, model, *, nof_instances=10000, axis_limits=None, schema=None, random_state=21)
Bases: RegionalEffectBase
Initialize the Regional Effect method.
Parameters:
| Name | Type | Description | Default |
|---|---|---|---|
data
|
ndarray
|
the design matrix, |
required |
model
|
callable
|
the black-box model,
|
required |
axis_limits
|
Union[None, ndarray]
|
Feature effect limits along each axis
When possible, specify the axis limits manually
Their shape is |
None
|
nof_instances
|
Union[int, str]
|
Max instances to use
|
10000
|
schema
|
Optional[Union[Schema, dict]]
|
input metadata (R10) — an
|
None
|
random_state
|
Optional[int]
|
seed for every internal random step (e.g.
|
21
|

Methods:
| Name | Description |
|---|---|
fit |
Find subregions by minimizing the ALE-based heterogeneity. |
plot |
Plot the regional ALE effect of |
Source code in effector/regional_effect_ale.py
214 215 216 217 218 219 220 221 222 223 224 225 226 227 228 229 230 231 232 233 234 235 236 237 238 239 240 241 242 243 244 245 246 247 248 249 250 251 252 253 254 255 256 257 258 259 260 261 262 263 264 265 266 267 268 269 270 271 272 273 274 275 276 277 278 279 280 | |
fit(features='all', *, candidate_conditioning_features='all', space_partitioner='best', binning_method='fixed')
Find subregions by minimizing the ALE-based heterogeneity.
Parameters:
| Name | Type | Description | Default |
|---|---|---|---|
features
|
Union[int, str, list]
|
for which features to search for subregions
|
'all'
|
candidate_conditioning_features
|
Union[str, list]
|
list of features to consider as conditioning features |
'all'
|
space_partitioner
|
Union[str, Best]
|
the space partitioner to use |
'best'
|
binning_method
|
Union[str, Fixed]
|
must be the Fixed binning method
|
'fixed'
|
Source code in effector/regional_effect_ale.py
282 283 284 285 286 287 288 289 290 291 292 293 294 295 296 297 298 299 300 301 302 303 304 305 306 307 308 309 310 311 312 313 314 315 316 317 318 | |
plot(feature, node_idx, heterogeneity=True, centering=None, scale_x_list=None, scale_y=None, y_limits=None, dy_limits=None, show_plot=True)
Plot the regional ALE effect of feature at node node_idx.
Parameters:
| Name | Type | Description | Default |
|---|---|---|---|
feature
|
int
|
the feature to plot |
required |
node_idx
|
int
|
the index of the node to plot |
required |
heterogeneity
|
Union[bool, str]
|
whether to plot the heterogeneity (std of the bin effects) |
True
|
centering
|
Union[None, bool, str]
|
whether to center the plot ( |
None
|
scale_x_list
|
Optional[list]
|
list with a |
None
|
scale_y
|
Optional[dict]
|
|
None
|
y_limits
|
Optional[list]
|
manual limits of the y-axis |
None
|
dy_limits
|
Optional[list]
|
manual limits of the dy/dx-axis |
None
|
show_plot
|
bool
|
if |
True
|
Source code in effector/regional_effect_ale.py
320 321 322 323 324 325 326 327 328 329 330 331 332 333 334 335 336 337 338 339 340 341 342 343 344 345 346 347 348 349 350 351 352 353 354 355 356 357 | |
effector.regional_effect_ale.RegionalRHALE(data, model, model_jac=None, *, data_effect=None, nof_instances=10000, axis_limits=None, schema=None, random_state=21)
Bases: RegionalEffectBase
Initialize the Regional Effect method.
Parameters:
| Name | Type | Description | Default |
|---|---|---|---|
data
|
ndarray
|
the design matrix, |
required |
model
|
Callable
|
the black-box model,
|
required |
model_jac
|
Optional[Callable]
|
the black-box model's Jacobian,
|
None
|
data_effect
|
Optional[ndarray]
|
The jacobian of the
When possible, provide the Jacobian directly Computing the jacobian on the whole dataset can be memory demanding. If you have the jacobian already computed, provide it directly to the constructor. |
None
|
axis_limits
|
Optional[ndarray]
|
Feature effect limits along each axis
When possible, specify the axis limits manually
Their shape is |
None
|
nof_instances
|
Union[int, str]
|
Max instances to use
|
10000
|
schema
|
Optional[Union[Schema, dict]]
|
input metadata (R10) — an
|
None
|
random_state
|
Optional[int]
|
seed for every internal random step (e.g.
|
21
|
Methods:
| Name | Description |
|---|---|
fit |
Find subregions by minimizing the RHALE-based heterogeneity. |
plot |
Plot the regional RHALE effect of |
Source code in effector/regional_effect_ale.py
15 16 17 18 19 20 21 22 23 24 25 26 27 28 29 30 31 32 33 34 35 36 37 38 39 40 41 42 43 44 45 46 47 48 49 50 51 52 53 54 55 56 57 58 59 60 61 62 63 64 65 66 67 68 69 70 71 72 73 74 75 76 77 78 79 80 81 82 83 84 85 86 87 88 89 90 91 92 93 94 95 96 97 98 99 100 | |
fit(features='all', *, candidate_conditioning_features='all', space_partitioner='best', binning_method='dp', binning_scope='global')
Find subregions by minimizing the RHALE-based heterogeneity.
Parameters:
| Name | Type | Description | Default |
|---|---|---|---|
features
|
Union[int, str, list]
|
for which features to search for subregions
|
'all'
|
candidate_conditioning_features
|
Union[str, list]
|
list of features to consider as conditioning features |
'all'
|
space_partitioner
|
Union[str, Best]
|
the space partitioner to use |
'best'
|
binning_method
|
str
|
the binning method to use.
|
'dp'
|
binning_scope
|
str
|
the x-range the binner covers when a subregion is re-binned (the split search and the node eval/plot alike)
|
'global'
|
Source code in effector/regional_effect_ale.py
114 115 116 117 118 119 120 121 122 123 124 125 126 127 128 129 130 131 132 133 134 135 136 137 138 139 140 141 142 143 144 145 146 147 148 149 150 151 152 153 154 155 156 157 158 159 160 161 162 163 164 165 166 167 168 169 170 171 | |
plot(feature, node_idx, heterogeneity=True, centering=None, scale_x_list=None, scale_y=None, y_limits=None, dy_limits=None, show_plot=True)
Plot the regional RHALE effect of feature at node node_idx.
Parameters:
| Name | Type | Description | Default |
|---|---|---|---|
feature
|
int
|
the feature to plot |
required |
node_idx
|
int
|
the index of the node to plot |
required |
heterogeneity
|
Union[bool, str]
|
whether to plot the heterogeneity (std of the bin effects) |
True
|
centering
|
Union[None, bool, str]
|
whether to center the plot ( |
None
|
scale_x_list
|
Optional[list]
|
list with a |
None
|
scale_y
|
Optional[dict]
|
|
None
|
y_limits
|
Optional[list]
|
manual limits of the y-axis |
None
|
dy_limits
|
Optional[list]
|
manual limits of the dy/dx-axis |
None
|
show_plot
|
bool
|
if |
True
|
Source code in effector/regional_effect_ale.py
173 174 175 176 177 178 179 180 181 182 183 184 185 186 187 188 189 190 191 192 193 194 195 196 197 198 199 200 201 202 203 204 205 206 207 208 209 210 | |
effector.regional_effect_pdp.RegionalPDP(data, model, *, nof_instances=10000, axis_limits=None, schema=None, random_state=21)
Bases: RegionalPDPBase
Initialize the Regional Effect method.
Parameters:
| Name | Type | Description | Default |
|---|---|---|---|
data
|
ndarray
|
the design matrix, |
required |
model
|
callable
|
the black-box model,
|
required |
axis_limits
|
Union[None, ndarray]
|
Feature effect limits along each axis
When possible, specify the axis limits manually
Their shape is |
None
|
nof_instances
|
Union[int, str]
|
Max instances to use
|
10000
|
schema
|
Optional[Union[Schema, dict]]
|
input metadata (R10) — an
|
None
|
random_state
|
Optional[int]
|
seed for every internal random step (e.g.
|
21
|
Methods:
| Name | Description |
|---|---|
fit |
Find subregions by minimizing the PDP-based heterogeneity. |
plot |
Plot the regional PDP effect of |
Source code in effector/regional_effect_pdp.py
38 39 40 41 42 43 44 45 46 47 48 49 50 51 52 53 54 55 56 57 58 59 60 61 62 63 64 65 66 67 68 69 70 71 72 73 74 75 76 77 78 79 80 81 82 83 84 85 86 87 88 89 90 91 92 93 94 95 96 97 98 99 100 101 102 103 104 105 | |
fit(features='all', *, candidate_conditioning_features='all', space_partitioner='best', points_for_centering=30, use_vectorized=True)
Find subregions by minimizing the PDP-based heterogeneity.
Parameters:
| Name | Type | Description | Default |
|---|---|---|---|
features
|
Union[int, str, list]
|
for which features to search for subregions
|
'all'
|
candidate_conditioning_features
|
Union[str, list]
|
list of features to consider as conditioning features
|
'all'
|
space_partitioner
|
Union[str, Best]
|
the method to use for partitioning the space |
'best'
|
points_for_centering
|
int
|
number of equidistant points along the feature axis used for centering ICE plots |
30
|
use_vectorized
|
bool
|
whether to use vectorized operations for the PDP and ICE curves |
True
|
Source code in effector/regional_effect_pdp.py
107 108 109 110 111 112 113 114 115 116 117 118 119 120 121 122 123 124 125 126 127 128 129 130 131 132 133 134 135 136 137 138 139 140 141 142 143 144 145 146 147 148 149 | |
plot(feature, node_idx, heterogeneity='ice', centering=None, nof_points=100, scale_x_list=None, scale_y=None, nof_ice=100, show_avg_output=False, y_limits=None, use_vectorized=True, show_plot=True)
Plot the regional PDP effect of feature at node node_idx.
Parameters:
| Name | Type | Description | Default |
|---|---|---|---|
feature
|
int
|
the feature to plot |
required |
node_idx
|
int
|
the index of the node to plot |
required |
heterogeneity
|
Union[bool, str]
|
whether to plot the heterogeneity ( |
'ice'
|
centering
|
Union[None, bool, str]
|
whether to center the plot ( |
None
|
nof_points
|
int
|
the grid size for the PDP curve |
100
|
scale_x_list
|
Union[None, list]
|
list with a |
None
|
scale_y
|
Union[None, dict]
|
|
None
|
nof_ice
|
Union[int, str]
|
number of ICE curves to show |
100
|
show_avg_output
|
bool
|
whether to show the average output of the model |
False
|
y_limits
|
Union[None, list]
|
manual limits of the y-axis |
None
|
use_vectorized
|
bool
|
whether to use the vectorized ICE computation |
True
|
show_plot
|
bool
|
if |
True
|
Source code in effector/regional_effect_pdp.py
151 152 153 154 155 156 157 158 159 160 161 162 163 164 165 166 167 168 169 170 171 172 173 174 175 176 177 178 179 180 181 182 183 184 185 186 187 188 189 190 191 192 193 194 195 196 197 | |
effector.regional_effect_pdp.RegionalDerPDP(data, model, model_jac=None, *, nof_instances=10000, axis_limits=None, schema=None, random_state=21)
Bases: RegionalPDPBase
Initialize the Regional Effect method.
Parameters:
| Name | Type | Description | Default |
|---|---|---|---|
data
|
ndarray
|
the design matrix, |
required |
model
|
callable
|
the black-box model,
|
required |
model_jac
|
Optional[callable]
|
the black-box model's Jacobian,
|
None
|
axis_limits
|
Union[None, ndarray]
|
Feature effect limits along each axis
When possible, specify the axis limits manually
Their shape is |
None
|
nof_instances
|
Union[int, str]
|
Max instances to use
|
10000
|
schema
|
Optional[Union[Schema, dict]]
|
input metadata (R10) — an
|
None
|
random_state
|
Optional[int]
|
seed for every internal random step (e.g.
|
21
|
Methods:
| Name | Description |
|---|---|
fit |
Find subregions by minimizing the PDP-based heterogeneity. |
plot |
Plot the regional d-PDP effect of |
Source code in effector/regional_effect_pdp.py
201 202 203 204 205 206 207 208 209 210 211 212 213 214 215 216 217 218 219 220 221 222 223 224 225 226 227 228 229 230 231 232 233 234 235 236 237 238 239 240 241 242 243 244 245 246 247 248 249 250 251 252 253 254 255 256 257 258 259 260 261 262 263 264 265 266 267 268 269 270 271 272 273 274 | |
fit(features='all', *, candidate_conditioning_features='all', space_partitioner='best', use_vectorized=True)
Find subregions by minimizing the PDP-based heterogeneity.
Parameters:
| Name | Type | Description | Default |
|---|---|---|---|
features
|
Union[int, str, list]
|
for which features to search for subregions
|
'all'
|
candidate_conditioning_features
|
Union[str, list]
|
list of features to consider as conditioning features
|
'all'
|
space_partitioner
|
Union[str, Best]
|
the method to use for partitioning the space |
'best'
|
use_vectorized
|
bool
|
whether to use vectorized operations for the PDP and ICE curves |
True
|
Source code in effector/regional_effect_pdp.py
276 277 278 279 280 281 282 283 284 285 286 287 288 289 290 291 292 293 294 295 296 297 298 299 300 301 302 303 304 305 306 307 308 309 310 311 312 313 | |
plot(feature, node_idx, heterogeneity='ice', centering=None, nof_points=100, scale_x_list=None, scale_y=None, nof_ice=100, show_avg_output=False, y_limits=None, use_vectorized=True, show_plot=True)
Plot the regional d-PDP effect of feature at node node_idx.
Parameters:
| Name | Type | Description | Default |
|---|---|---|---|
feature
|
int
|
the feature to plot |
required |
node_idx
|
int
|
the index of the node to plot |
required |
heterogeneity
|
Union[bool, str]
|
whether to plot the heterogeneity ( |
'ice'
|
centering
|
Union[None, bool, str]
|
whether to center the plot ( |
None
|
nof_points
|
int
|
the grid size for the d-PDP curve |
100
|
scale_x_list
|
Union[None, list]
|
list with a |
None
|
scale_y
|
Union[None, dict]
|
|
None
|
nof_ice
|
Union[int, str]
|
number of d-ICE curves to show |
100
|
show_avg_output
|
bool
|
whether to show the average output of the model |
False
|
y_limits
|
Union[None, list]
|
manual limits of the y-axis (derivative units) |
None
|
use_vectorized
|
bool
|
whether to use the vectorized ICE computation |
True
|
show_plot
|
bool
|
if |
True
|
Source code in effector/regional_effect_pdp.py
315 316 317 318 319 320 321 322 323 324 325 326 327 328 329 330 331 332 333 334 335 336 337 338 339 340 341 342 343 344 345 346 347 348 349 350 351 352 353 354 355 356 357 358 359 360 361 | |
effector.regional_effect_shap.RegionalShapDP(data, model, *, nof_instances=1000, axis_limits=None, schema=None, random_state=21, shap_values=None, backend='shap', budget=512, shap_explainer_kwargs=None, shap_explanation_kwargs=None)
Bases: RegionalEffectBase
Initialize the Regional Effect method.
Parameters:
| Name | Type | Description | Default |
|---|---|---|---|
data
|
ndarray
|
the design matrix, |
required |
model
|
Callable
|
the black-box model,
|
required |
axis_limits
|
Optional[ndarray]
|
Feature effect limits along each axis
When possible, specify the axis limits manually
Their shape is |
None
|
nof_instances
|
Union[int, str]
|
Max instances to use
|
1000
|
schema
|
Optional[Union[Schema, dict]]
|
input metadata (R10) — an
|
None
|
random_state
|
Optional[int]
|
seed for every internal random step (
|
21
|
backend
|
str
|
Package to compute SHAP values
|
'shap'
|
Methods:
| Name | Description |
|---|---|
fit |
Fit the regional SHAP. |
plot |
Plot the regional SHAP. |
Source code in effector/regional_effect_shap.py
15 16 17 18 19 20 21 22 23 24 25 26 27 28 29 30 31 32 33 34 35 36 37 38 39 40 41 42 43 44 45 46 47 48 49 50 51 52 53 54 55 56 57 58 59 60 61 62 63 64 65 66 67 68 69 70 71 72 73 74 75 76 77 78 79 80 81 82 83 84 85 86 87 88 89 90 91 92 93 94 95 | |
fit(features='all', *, candidate_conditioning_features='all', space_partitioner='best', binning_method='dp', binning_scope='global')
Fit the regional SHAP.
Parameters:
| Name | Type | Description | Default |
|---|---|---|---|
features
|
Union[int, str, list]
|
the features to fit. - If set to "all", all the features will be fitted. |
'all'
|
candidate_conditioning_features
|
Union[str, list]
|
list of features to consider as conditioning features for the candidate splits - If set to "all", all the features will be considered as conditioning features. |
'all'
|
space_partitioner
|
Union[str, Best]
|
the space partitioner to use - If set to "greedy", the greedy space partitioner will be used. |
'best'
|
binning_method
|
Union[str, DynamicProgramming, Agglomerative, Quantile, Fixed]
|
the binning method to use |
'dp'
|
binning_scope
|
str
|
the x-range the binner covers when a subregion is re-binned (the split search and the node eval/plot alike)
|
'global'
|
budget
|
Budget to use for the approximation. Defaults to 512. - Increasing the budget improves the approximation at the cost of slower computation. - Decrease the budget for faster computation at the cost of approximation error. |
required | |
shap_explainer_kwargs
|
the keyword arguments to be passed to the Code behind the sceneSee |
required | |
shap_explanation_kwargs
|
the keyword arguments to be passed to the Code behind the sceneSee |
required |
Source code in effector/regional_effect_shap.py
109 110 111 112 113 114 115 116 117 118 119 120 121 122 123 124 125 126 127 128 129 130 131 132 133 134 135 136 137 138 139 140 141 142 143 144 145 146 147 148 149 150 151 152 153 154 155 156 157 158 159 160 161 162 163 164 165 166 167 168 169 170 171 172 173 174 175 176 177 178 179 180 181 | |
plot(feature, node_idx, heterogeneity='shap_values', centering=None, nof_points=100, scale_x_list=None, scale_y=None, nof_shap_values=100, show_avg_output=False, y_limits=None, only_shap_values=False, show_plot=True)
Plot the regional SHAP.
Parameters:
| Name | Type | Description | Default |
|---|---|---|---|
feature
|
int
|
the feature to plot |
required |
node_idx
|
int
|
the index of the node to plot |
required |
heterogeneity
|
Union[bool, str]
|
whether to plot the heterogeneity |
'shap_values'
|
centering
|
Union[None, bool, str]
|
whether to center the SHAP values ( |
None
|
nof_points
|
int
|
number of points to plot |
100
|
scale_x_list
|
Optional[list]
|
the list of scaling factors for the feature names |
None
|
scale_y
|
Optional[dict]
|
the scaling factor for the SHAP values |
None
|
nof_shap_values
|
Union[int, str]
|
number of SHAP values to plot |
100
|
show_avg_output
|
bool
|
whether to show the average output |
False
|
y_limits
|
Optional[list]
|
the limits of the y-axis |
None
|
only_shap_values
|
bool
|
whether to plot only the SHAP values |
False
|
show_plot
|
bool
|
if |
True
|
Source code in effector/regional_effect_shap.py
183 184 185 186 187 188 189 190 191 192 193 194 195 196 197 198 199 200 201 202 203 204 205 206 207 208 209 210 211 212 213 214 215 216 217 218 219 220 221 222 223 224 225 226 227 228 229 230 | |