Model with conditional interaction
- Author: givasile
- Runtime: ~5 s
- Description: Global effects (PDP, ALE, RHALE) on a model whose three-way
conditional interaction defines four regions; the estimates are derived
analytically and tested against
effector.benchmarks. - 📄 The whole notebook in one page: PDP report
In this example, we show global effects of a model with conditional interactions using PDP, ALE, and RHALE. In particular, we:
- show how to use
effectorto estimate the global effects using PDP, ALE, and RHALE - provide the analytical formulas for the global effects
- test that (1) and (2) match
We will use the following model:
Here, the features \(x_1\), \(x_2\), \(x_3\), \(x_4\) are independent and uniformly distributed in the interval \([-1, 1]\).
The model exhibits interactions between \(x_1\), \(x_2\), and \(x_3\), caused by the piecewise terms.
This means the effect of \(x_1\) on the output \(y\) depends on the values of both \(x_2\) and \(x_3\), and vice versa. These interactions make it challenging to isolate the individual contributions of \(x_1\), \(x_2\), and \(x_3\). Each global effect method has a different strategy to handle such multi-way interactions.
On the other hand, \(x_4\) does not interact with any other feature, so its effect can be easily computed as \(e^{x_4}\).
Below, we will see how methods like PDP, ALE, and RHALE handle these interactions and compute feature effects in this updated model.
import numpy as np
import matplotlib.pyplot as plt
import effector

np.random.seed(21)

bench = effector.benchmarks.ConditionalInteraction4RegionsUniform()
model = bench.model
dataset = bench.dataset
x = bench.generate_data(1000)
PDP
Effector
Let's see below the PDP effects for each feature, using effector.
pdp = effector.PDP(x, model.predict, axis_limits=dataset.axis_limits)
pdp.fit(features="all", centering=True)
for feature in [0, 1, 2, 3]:
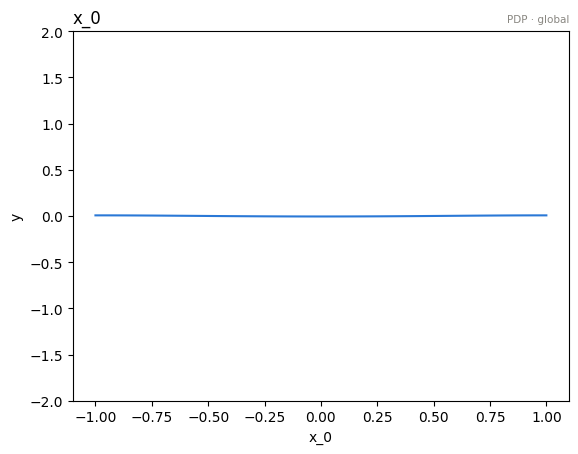
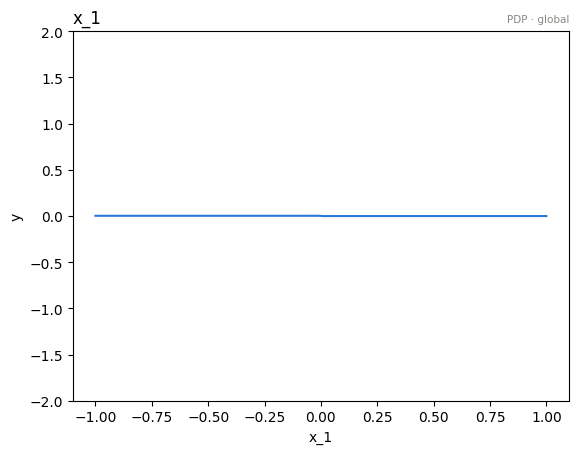
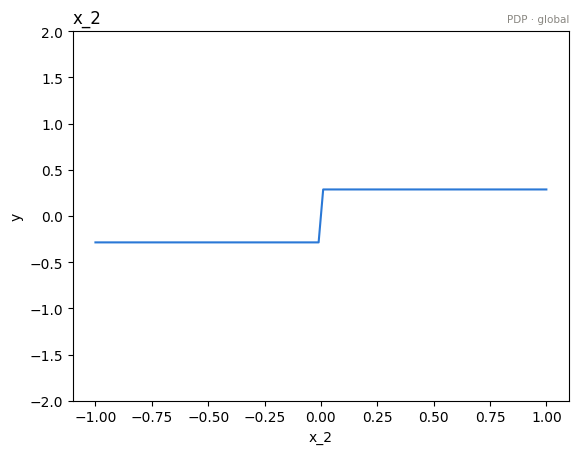
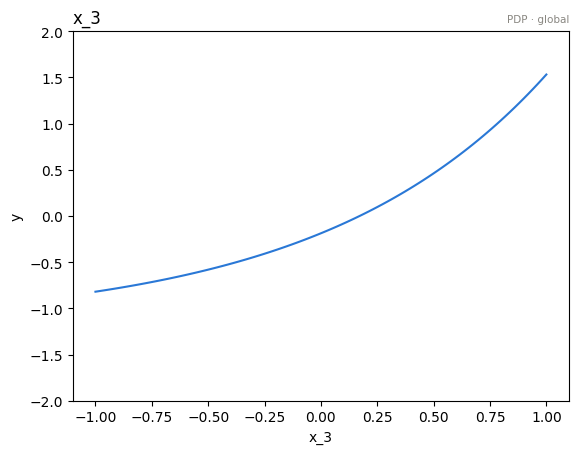
    pdp.plot(feature=feature, centering=True, y_limits=[-2, 2], heterogeneity=False)
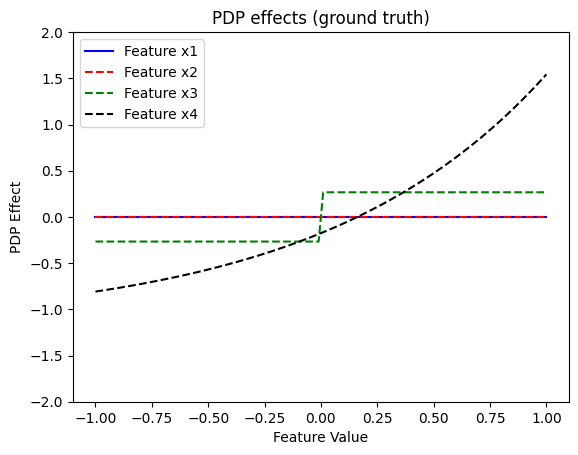
PDP states that:
\(x_1\) has a zero average effect on the model output because the symmetric contributions of its positive and negative terms cancel each other out.
\(x_2\) has a constant effect close to zero for both \(x_2 < 0\) and \(x_2 \geq 0\). There is no significant change in \(y\) when moving between \(x_2^-\) and \(x_2^+\), as the average effects cancel out.
\(x_3\) has a stepwise effect on the model output:
- For \(x_3 < 0\), the average contribution is \(-\frac{4}{15}\).
- For \(x_3 \geq 0\), the average contribution is \(+\frac{4}{15}\).
\(x_4\) has an effect of \(e^{x_4}\)
Derivations
How PDP leads to these explanations? Are they meaningfull? Let's have some analytical derivations. If you don't care about the derivations, skip the following three cells and go directly to the coclusions.
For \(x_1\):
For \(x_2\):
Taking the expectation over \(x_1, x_3, x_4\), we find:
- For \(x_2 < 0\):
- For \(x_2 \geq 0\):
Thus:
For \(x_3\):
Taking the expectation over \(x_1, x_2, x_4\), we find:
- For \(x_3 < 0\):
- For \(x_3 \geq 0\):
Thus, the global PDP for \(x_3\) is a step function:
For \(x_4\):
Conclusions
Are the PDP effects intuitive?
-
For \(x_1\):
The effect is zero. The terms related to \(x_1\) are \(-x_1^2 \mathbb{1}_{x_3 < 0} + x_1^2 \mathbb{1}_{x_3 \geq 0}\) when \(x_2 < 0\), and \(-x_1^4 \mathbb{1}_{x_3 < 0} + x_1^4 \mathbb{1}_{x_3 \geq 0}\) when \(x_2 \geq 0\). Since \(x_2, x_3 \sim \mathcal{U}(-1,1)\), the symmetric distribution of these variables ensures that, on average, the positive and negative contributions of \(x_1\) cancel out. -
For \(x_2\):
The effect is constant and close to zero for both \(x_2 < 0\) and \(x_2 \geq 0\). The terms involving \(x_2\) are \(-x_1^2 \mathbb{1}_{x_3 < 0} + x_1^2 \mathbb{1}_{x_3 \geq 0}\) for \(x_2 < 0\), and \(-x_1^4 \mathbb{1}_{x_3 < 0} + x_1^4 \mathbb{1}_{x_3 \geq 0}\) for \(x_2 \geq 0\). These terms cancel on average due to the uniform distribution of \(x_1\) and \(x_3\). -
For \(x_3\):
The effect is stepwise: - For \(x_3 < 0\), the terms \(-x_1^2 \mathbb{1}_{x_2 < 0} - x_1^4 \mathbb{1}_{x_2 \geq 0}\) contribute an average of \(-\frac{4}{15}\).
-
For \(x_3 \geq 0\), the terms \(x_1^2 \mathbb{1}_{x_2 < 0} + x_1^4 \mathbb{1}_{x_2 \geq 0}\) contribute an average of \(+\frac{4}{15}\).
-
For \(x_4\):
The effect is \(e^{x_4}\), as expected, since the \(e^{x_4}\) term is independent of other variables and directly contributes to the output.
# The closed form below lives in `effector.benchmarks` — the SAME function the
# test suite asserts against (tests/test_functional_four_regions.py),
# so this notebook and the tests can never disagree about the right answer.
pdp_ground_truth = bench.pdp_gt
xx = np.linspace(-1, 1, 100)
y_pdp = []
for feature in [0, 1, 2, 3]:
    y_pdp.append(pdp_ground_truth(feature, xx))

plt.figure()
plt.title("PDP effects (ground truth)")
color_pallette = ["blue", "red", "green", "black"]
feature_labels = ["Feature x1", "Feature x2", "Feature x3", "Feature x4"]
for feature in [0, 1, 2, 3]:
    plt.plot(
        xx,
        y_pdp[feature],
        color=color_pallette[feature],
        linestyle="--" if feature !=0 else "-",
        label=feature_labels[feature]
    )
plt.legend()
plt.xlim([-1.1, 1.1])
plt.ylim([-2, 2])
plt.xlabel("Feature Value")
plt.ylabel("PDP Effect")
plt.show()
# make a test
xx = np.linspace(-1, 1, 100)
for feature in [0, 1, 2, 3]:
    y_pdp = pdp.eval(feature=feature, xs=xx, centering=True)
    y_gt = pdp_ground_truth(feature, xx)
    np.testing.assert_allclose(y_pdp, y_gt, atol=1e-1)
ALE
Effector
Let's see below the PDP effects for each feature, using effector.
ale = effector.ALE(x, model.predict, axis_limits=dataset.axis_limits)
ale.fit(features="all", centering=True, binning_method=effector.axis_partitioning.Fixed(nof_bins=31))

for feature in [0, 1, 2, 3]:
    ale.plot(feature=feature, centering=True, y_limits=[-2, 2], heterogeneity=False)
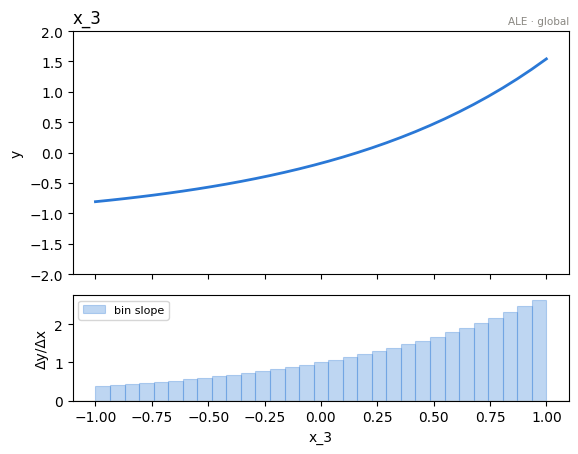
ALE states that:
Derivations
For \(x_1\):
For \(x_2\):
For \(x_3\):
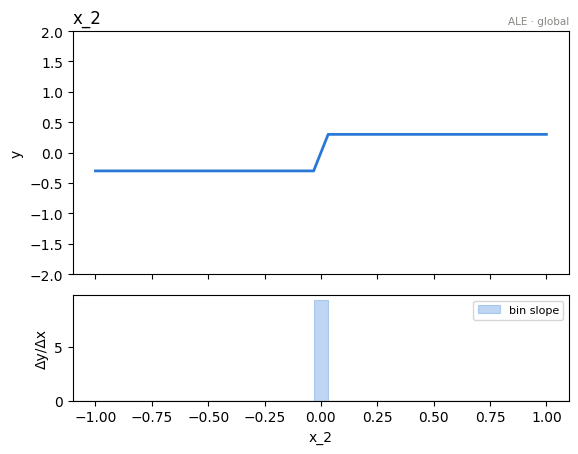
In the inner expression, if \(z_k, z_{k-1}\) are both positive or both negative, then it can be seen that the corresponding terms cancel each other out, thus the contribution to the outer sum is 0. Only when \(z_k > 0 > z_{k-1}\) is the inner expression nonzero, and specifically equal to:
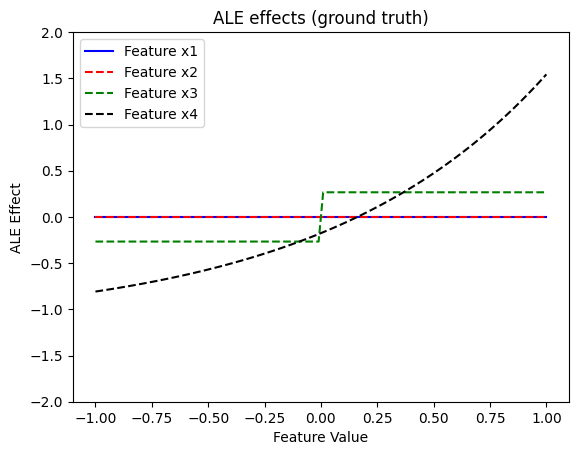
So: \begin{equation} ALE(x_3) \propto \begin{cases} c & x_3 < 0 \ c + \frac{8}{15} & x_3 \geq 0 \end{cases} \end{equation}
For \(x_4\):
# The closed form below lives in `effector.benchmarks` — the SAME function the
# test suite asserts against (tests/test_functional_four_regions.py),
# so this notebook and the tests can never disagree about the right answer.
ale_ground_truth = bench.ale_gt
xx = np.linspace(-1, 1, 100)
y_ale = []
for feature in [0, 1, 2, 3]:
    y_ale.append(ale_ground_truth(feature, xx))

plt.figure()
plt.title("ALE effects (ground truth)")
color_pallette = ["blue", "red", "green", "black"]
feature_labels = ["Feature x1", "Feature x2", "Feature x3", "Feature x4"]
for feature in [0, 1, 2, 3]:
    plt.plot(
        xx,
        y_ale[feature],
        color=color_pallette[feature],
        linestyle="--" if feature !=0 else "-",
        label=feature_labels[feature]
    )
plt.legend()
plt.xlim([-1.1, 1.1])
plt.ylim([-2, 2])
plt.xlabel("Feature Value")
plt.ylabel("ALE Effect")
plt.show()
xx = np.linspace(-1, 1, 100)
# atol per feature, mirroring tests/test_functional_four_regions.py: x1's ALE is
# 0 only in expectation — its finite-difference bin means carry O(1/sqrt(N))
# sampling noise (~0.11 at N=1000)
atols = {0: 1.5e-1, 1: 1e-1, 2: 1e-1, 3: 1e-1}
for feature in [0, 1, 2, 3]:
    y_ale = ale.eval(feature=feature, xs=xx, centering=True)
    y_gt = ale_ground_truth(feature, xx)

    # mask the bin containing the discontinuity of x3's step effect: inside it
    # the binned estimate interpolates the jump — an artifact, not an error
    if feature == 2:
        K = 31
        ind = np.logical_and(xx > -1/K, xx < 1/K)
        y_ale[ind] = 0
        y_gt[ind] = 0

    np.testing.assert_allclose(y_ale, y_gt, atol=atols[feature])
Conclusions
Are the ALE effects intuitive?
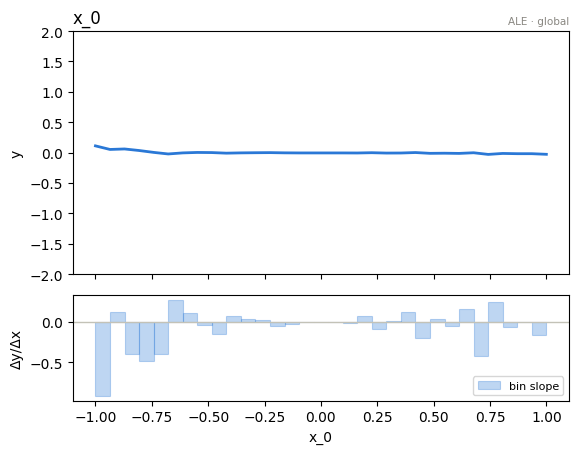
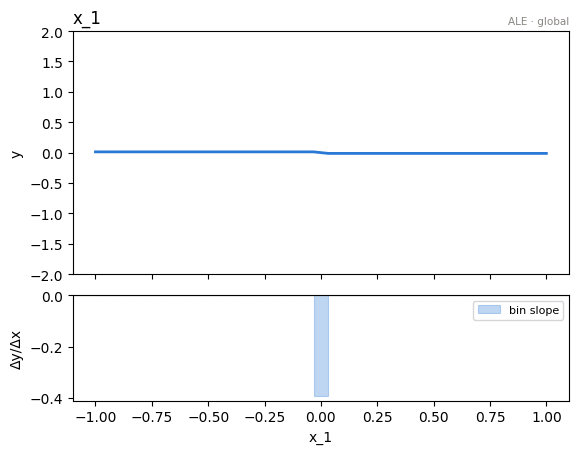
ALE effects are identical to PDP effects which, as discussed above, can be considered intutive.
RHALE
Effector
Let's see below the RHALE effects for each feature, using effector.
rhale = effector.RHALE(x, model.predict, model.jacobian, axis_limits=dataset.axis_limits)
rhale.fit(features="all", centering=True, binning_method=effector.axis_partitioning.Fixed(nof_bins=31))

for feature in [0, 1, 2, 3]:
    rhale.plot(feature=feature, centering=True, y_limits=[-2, 2], heterogeneity=False)
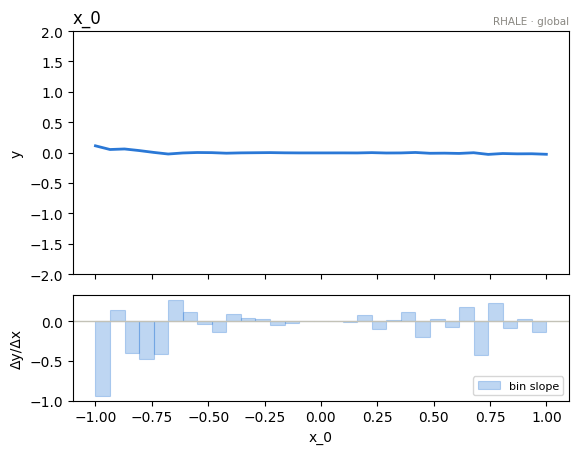
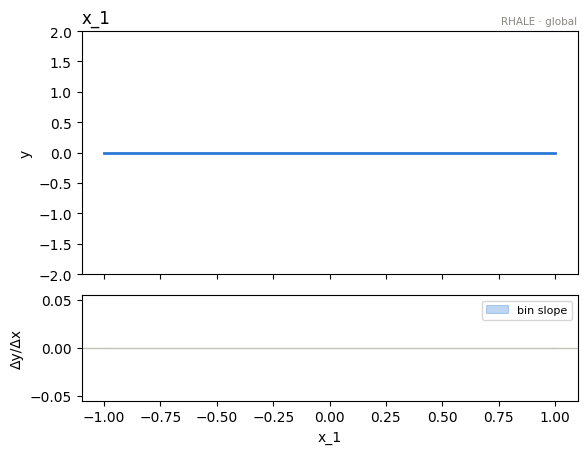
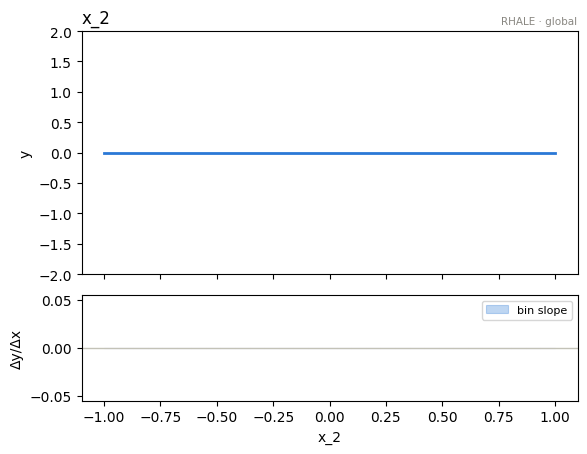
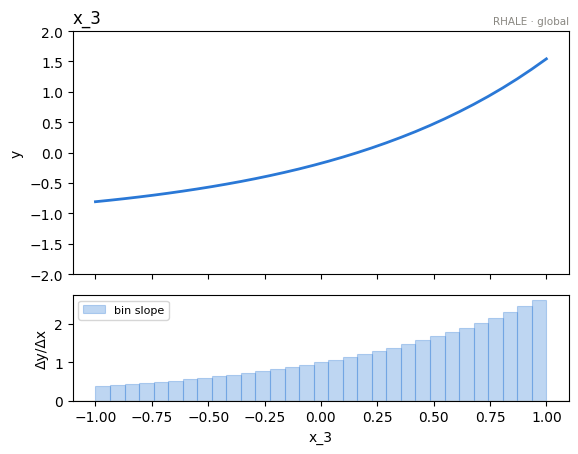
RHALE states that:
Derivations
For \(x_1\):
since the variables are distributed uniformly in \([-1, 1]\).
For \(x_2\):
For \(x_3\):
For \(x_4\):
# The closed form below lives in `effector.benchmarks` — the SAME function the
# test suite asserts against (tests/test_functional_four_regions.py),
# so this notebook and the tests can never disagree about the right answer.
rhale_ground_truth = bench.rhale_gt
xx = np.linspace(-1, 1, 100)
y_rhale = []
for feature in [0, 1, 2, 3]:
    y_rhale.append(rhale_ground_truth(feature, xx))

plt.figure()
plt.title("RHALE effects (ground truth)")
color_pallette = ["blue", "red", "green", "black"]
feature_labels = ["Feature x1", "Feature x2", "Feature x3", "Feature x4"]
for feature in [0, 1, 2, 3]:
    plt.plot(
        xx,
        y_rhale[feature],
        color=color_pallette[feature],
        linestyle="-" if feature in [0,1] else "--",
        linewidth=6 if feature == 0 else 3,
        label=feature_labels[feature]
    )
plt.legend()
plt.xlim([-1.1, 1.1])
plt.ylim([-2, 2])
plt.xlabel("Feature Value")
plt.ylabel("RHALE Effect")
plt.show()
# atol per feature: x1's RHALE is 0 only in expectation — the per-bin means of
# +-2x / +-4x^3 carry O(1/sqrt(N)) sampling noise that accumulates through the
# integration (~0.11 at N=1000, shrinking ~1/sqrt(N)). The other features'
# ground truths are deterministic and stay tight.
atols = {0: 1.5e-1, 1: 1e-2, 2: 1e-2, 3: 1e-2}
for feature in [0, 1, 2, 3]:
    y_rhale = rhale.eval(feature=feature, xs=xx, centering=True)
    y_gt = rhale_ground_truth(feature, xx)
    np.testing.assert_allclose(y_rhale, y_gt, atol=atols[feature])
Conclusions
Are the RHALE effects intuitive?
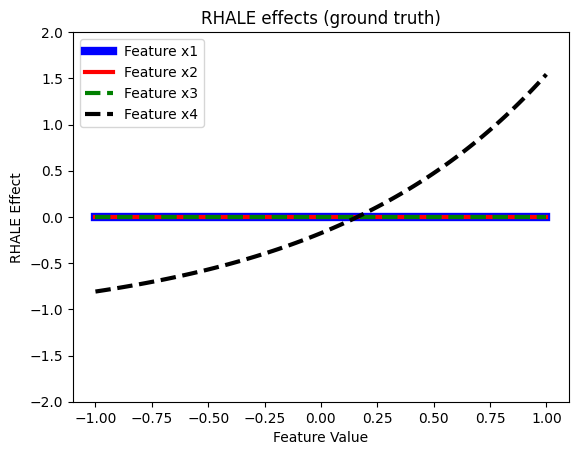
Yes, we could safely say that they are intuitive. All are the same as in the previous methods (which we already discussed), the only exception being \(x_3\), for which the RHALE is now flat, instead of having a step at 0 like before. This can be explained, since RHALE plots work with the derivatives and all derivatives with respect to \(x_3\) are zero, provided we do not evaluate them at exactly 0, which we probably do not.
Feature importance and one-click explanation
Beyond the per-feature effect curves, effector exposes two convenience layers on top of
the same global effects:
fx.importances()returns a per-feature importance score — the dispersion of the mean effect (the \(\mu\)-twin of heterogeneity). Here \(x_3\) (the stepwise feature) and \(x_4\) (the \(e^{x_4}\) term) should score highest, while \(x_1\) and \(x_2\) are near zero.effector.explain(...)runs the whole pipeline and returns a serializableReportwith a self-contained HTML rendering.
# per-feature importance = dispersion of the mean effect (mu-twin of heterogeneity)
print("importances:", np.round(pdp.importances(), 3))

# one-click auto-explanation -> Report (serializable; self-contained HTML)
report = effector.explain(x, model.predict, method="pdp", nof_instances="all")
report.show()

# the whole notebook, in one page: the report published with this example
from pathlib import Path
_out = Path("reports") / "07_conditional_interaction_4_regions_independent_uniform_global"
_out.mkdir(parents=True, exist_ok=True)
report.to_html(_out / "report_pdp.html")
importances: [0.004 0.002 0.282 0.65 ]
[effector] global effects   (GAM)  -> 84.9% of the model's variance
           regional effects (CALM) -> 99.8%

  ════════════════════════════════════════════════════════════════════════
  PDP report  ·  target: y
  ════════════════════════════════════════════════════════════════════════

  DATA & MODEL
  ────────────────────────────────────────────────────────────────────────
    instances     1,000
    features      4  ·  4 continuous
    model output  mean 1.21 · std 0.776 · range [-0.549, 3.63]

  EXPLAINED VARIANCE
  ────────────────────────────────────────────────────────────────────────
    step         split on                 solo     ΔR²      R²       heter
    ──────────────────────────────────────────────────────────────────────
    GAM          (all features global)       —       —   84.9%           —
  + x_0          x_1, x_2               +14.9%  +14.9%   99.8% 0.29 → 0.00
    ──────────────────────────────────────────────────────────────────────
    FINAL                                                99.8%

  REJECTED SPLITS                                            min gain 1.0%
  ────────────────────────────────────────────────────────────────────────
    feature      split on                 solo     ΔR²    reason
    ──────────────────────────────────────────────────────────────────────
  ✗ x_2          x_0                    +10.0%   -9.8%    redundant

    ✗ redundant: it would explain variance on its own (see solo),
      but the accepted splits already account for it.

  FEATURES                                ranked, in the selected snapshot
  ────────────────────────────────────────────────────────────────────────
    feature        importance                          heter      #regions
    ──────────────────────────────────────────────────────────────────────
    x_3                0.6500  ██████████████████     0.0000             1
    x_0                0.2886  ████████               0.0000             4
    x_2                0.2817  ████████               0.2993             1
    ──────────────────────────────────────────────────────────────────────
    the features above carry 100% of the total importance mass


Feature 0 - Full partition tree:
🌳 Full Tree Structure:
───────────────────────
x_0 🔹 [id: 0 | heter: 0.29 | inst: 1000 | w: 1.00]
    x_2 < -0.00 🔹 [id: 1 | heter: 0.05 | inst: 494 | w: 0.49]
        x_1 < -0.00 🔹 [id: 2 | heter: 0.00 | inst: 243 | w: 0.24]
        x_1 ≥ -0.00 🔹 [id: 3 | heter: 0.00 | inst: 251 | w: 0.25]
    x_2 ≥ -0.00 🔹 [id: 4 | heter: 0.05 | inst: 506 | w: 0.51]
        x_1 < -0.00 🔹 [id: 5 | heter: 0.00 | inst: 268 | w: 0.27]
        x_1 ≥ -0.00 🔹 [id: 6 | heter: 0.00 | inst: 238 | w: 0.24]
--------------------------------------------------
Feature 0 - Statistics per tree level:
🌳 Tree Summary:
─────────────────
Level 0🔹heter: 0.29
    Level 1🔹heter: 0.05 | 🔻0.25 (84.50%)
        Level 2🔹heter: 0.00 | 🔻0.05 (100.00%)


/home/givasile/github/packages/effector/effector/report.py:606: UserWarning: This figure includes Axes that are not compatible with tight_layout, so results might be incorrect.
  fig.tight_layout()
Cross-method sanity check
The one-liner effector.explain with every engine this notebook's model
supports. Everything must run end to end; the closing table puts the reads
side by side. Where methods disagree — ranking, accepted splits, R² — that is
a property of the data/model worth a closer look, not an error.
from pathlib import Path
_out = Path("reports") / "07_conditional_interaction_4_regions_independent_uniform_global"
_out.mkdir(parents=True, exist_ok=True)

# === cross-method sweep: effector.explain on every applicable engine ======
sweep_reports = {}
for _m in ["pdp", "derpdp", "ale", "rhale", "shapdp"]:
    _kw = {"nof_instances": 300} if _m == "shapdp" else {}
    print(f"--- {_m} " + "-" * 50)
    sweep_reports[_m] = effector.explain(
        x, model.predict, model.jacobian, method=_m, **_kw
    )
    if _m != "pdp":  # the published report is the narrated one above
        sweep_reports[_m].to_html(_out / f"report_{_m}.html")

print()
print(f"{'method':<8} {'ranking (plotted)':<44} {'GAM R2':>8} {'final R2':>9}  splits")
for _m, _r in sweep_reports.items():
    _rank = " > ".join(fr.name for fr in _r.features)
    _ev = _r.explained_variance
    if _ev:
        _sp = "; ".join(f"{s['name']} on {s['on']}" for s in _ev["stages"]) or "none"
        print(f"{_m:<8} {_rank:<44} {_ev['gam_r2']:>7.1%} {_ev['regional_r2']:>8.1%}  {_sp}")
    else:
        print(f"{_m:<8} {_rank:<44} {'-':>7} {'-':>8}  (derivative scale: no variance ledger)")

print(f"\nreports stored in {_out}/")
--- pdp --------------------------------------------------
[effector] global effects   (GAM)  -> 84.9% of the model's variance
           regional effects (CALM) -> 99.8%
--- derpdp --------------------------------------------------


/home/givasile/github/packages/effector/effector/report.py:606: UserWarning: This figure includes Axes that are not compatible with tight_layout, so results might be incorrect.
  fig.tight_layout()


--- ale --------------------------------------------------


[effector] global effects   (GAM)  -> 84.4% of the model's variance
           regional effects (CALM) -> 99.2%


/home/givasile/github/packages/effector/effector/report.py:606: UserWarning: This figure includes Axes that are not compatible with tight_layout, so results might be incorrect.
  fig.tight_layout()


--- rhale --------------------------------------------------
[effector] global effects   (GAM)  -> 71.6% of the model's variance
           regional effects (CALM) -> 100.0%


/home/givasile/github/packages/effector/effector/report.py:606: UserWarning: This figure includes Axes that are not compatible with tight_layout, so results might be incorrect.
  fig.tight_layout()


--- shapdp --------------------------------------------------


[effector] global effects   (GAM)  -> 81.4% of the model's variance
           regional effects (CALM) -> 96.7%


/home/givasile/github/packages/effector/effector/report.py:606: UserWarning: This figure includes Axes that are not compatible with tight_layout, so results might be incorrect.
  fig.tight_layout()


method   ranking (plotted)                              GAM R2  final R2  splits
pdp      x_3 > x_0 > x_2                                84.9%    99.8%  x_0 on x_1, x_2
derpdp   x_3                                                -        -  (derivative scale: no variance ledger)
ale      x_3 > x_0 > x_2                                84.4%    99.2%  x_0 on x_1, x_2
rhale    x_3 > x_0                                      71.6%   100.0%  x_0 on x_1, x_2
shapdp   x_3 > x_2 > x_0                                81.4%    96.7%  x_0 on x_2; x_2 on x_0

reports stored in reports/07_conditional_interaction_4_regions_independent_uniform_global/