The global baseline
Description
The seventh component of effector's report: section 3 of the HTML page. The split features' global curves, kept at the end as the honest before picture.
Reading time
Approx. 2' to read.
What you see
For every feature whose split was accepted, section 3 repeats the global mean effect: the curve you would have read if you had never split anything.
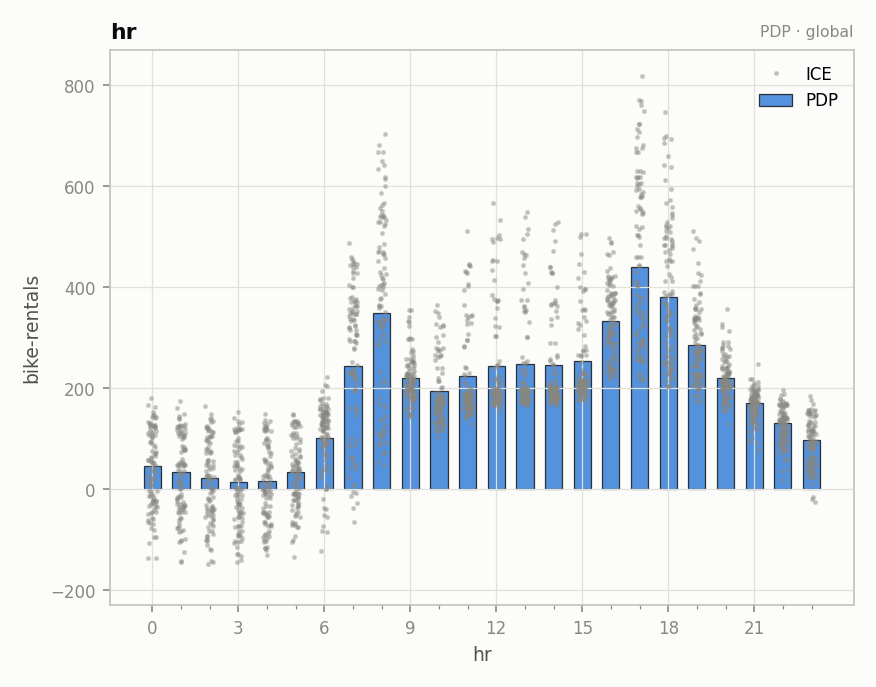
hr's global effect. The ICE cloud around the evening peak is the spread the
accepted split just explained; in this counterfactual it still hides inside
the band.
The chips here say global importance and global heterogeneity: the
before numbers (0.48 for hr), not the snapshot means of
the ranked features (0.29). The section only exists
when at least one split was accepted; a purely additive model has nothing to
compare against.
Why keep the before picture
So the report can be checked, not just trusted. Put hr here against its
subregions in the regional analysis: the global
curve is not wrong, it is the correct average; the baseline shows what that
average was hiding, and the ledger prices the
difference (+15.5%). It is also the explanation you would have shipped with
a purely global method; keeping it visible is what makes the regional claim
falsifiable.
Where to next
- Configuring the report: the last page of this guide
- effector's report: back to the guide's map
- The regional analysis: the after picture