The triage plane
Description
The fifth component of effector's report: the triage plane. Every feature as one point, importance against heterogeneity, and one arrow per accepted split. Where to look first.
Reading time
Approx. 4' to read.
What you see
The Overview section of the HTML page draws every supported feature on two axes, both in the output's units:
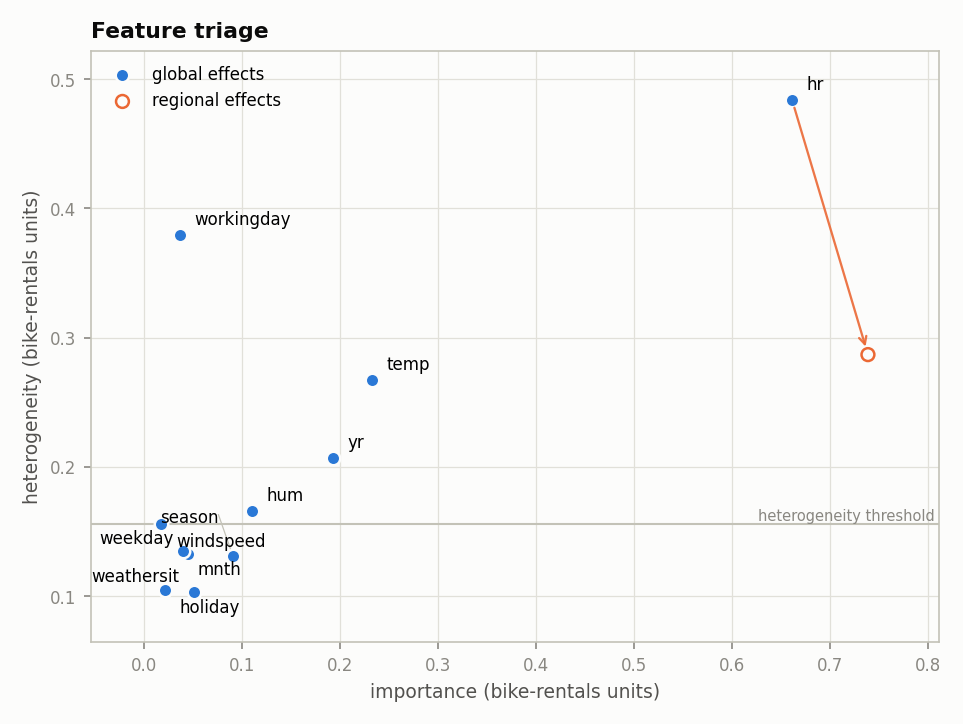
From the report embedded in the guide's map, the default
nof_instances=10_000 run.
- x, importance: how much the feature's mean effect moves the output.
- y, heterogeneity: how much the per instance effects spread around that mean.
Reading the quadrants
quadrantChart
    x-axis Low importance --> High importance
    y-axis Low heterogeneity --> High heterogeneity
    quadrant-1 Your to-do list
    quadrant-2 Noisy, but weak
    quadrant-3 Ignore
    quadrant-4 Done, the mean effect is the whole story
Bottom left is ignorable. Bottom right is important and fully described by
its mean effect: read the curve, done. The top right corner, important and
heterogeneous, is where the mean hides something: that is where the regional
analysis goes hunting. In the figure, hr sits alone in that corner.
The arrows
An arrow marks each split the decision sequence accepted: from the
feature's global point to its instance weighted mean across the subregions.
hr starts at heterogeneity 0.48 and lands at 0.29: the split resolved that
much spread, and it is the same 0.48 → 0.29 movement the
explained variance ledger charges +15.5% for.
Why does workingday have no arrow?
It is the second most heterogeneous feature on the plane, well above the
threshold, and the search did find a split for it. But an arrow must be
earned: the decision sequence rejected workingday's split as
redundant, because hr's split already conditions on it. High
heterogeneity gets a feature searched, not accepted; the verdicts
live in the rejected splits.
The threshold line
The hairline is heter_threshold: features below it never enter the region
search, because there is not enough spread to explain. By default it sits at
the median heterogeneity of the supported features; set it yourself in
the configuration.
Draw it yourself
The plane is not report only. effector.plot_triage(effect) draws it for any
fitted engine, and plot_triage(effect, partitions=...) adds the arrows for
partitions you found by hand: see
compare and plot_triage.
Where to next
- The regional analysis: the next component
- effector's report: back to the guide's map
- The ranked features: the same two axes, as a table